FastMetrics, Part 2 - Client Side Aggregation
Why and how to aggregate on the clients, website metrics example.
Background
Welcome to Part 2 in the Monitoring Fast Metrics series! Before we go filling up our shiny new logging server that we configured in the last article, let’s explore the potential of the new infinite computing power we have at our fingertips: a costless internet scale map-reduce engine we can unlock to pre-aggregate all of our data. That’s not even the best part of it - it scales up instantaneously, just as fast as your users connect to it:
The user’s device!

Traditional data analytics flows generally go something like this:
- Add a logging hook to the code where you’re interested in some user action,
- Send that log to the server, possibly right when the user is trying to make progress,
- Process a massive set of data on servers you pay for, in order to summarize or even reject the data itself, and
- Make a decision based on that data, since Data > Opinions.
Unfortunately, step 3 can get pricey, step 2 can get in the way of the user experience, and trying to optimize these we might end up with a lot of lag before getting to step 4, which leaves us with two suboptimal choices:
- Computing Averages, or
- Sampling the population.
There are plenty of situations where these strategies make sense, but that should only apply to when you actually want an average of a metric, or a sample of the population. Sadly, these strategies are usually chosen because there’s either too much data to log, or there’s an assumption that the data distribution may not be important. Just ask the Datasaurus Dozen what they think of averages or sample stats:

Like Anscombe’s quartet, all of these images have the same summary statistics (such as mean or standard deviation), however the data sets were all clearly very different.
There is, however, a better way which doesn’t involve choosing between two suboptimal options - instead, we can have the client do some work for us, and assemble the data that we want to collect.
Before I continue with this technique, two quick caveats:
- Don’t aggregate data if your underlying metrics aren’t moving that fast (it’s probably easier to just batch the data and emit one log), and
- Don’t get in the way of the user experience - it’s important to ensure you’re not affecting the site’s responsiveness.
Today’s Agenda:
For this example, I’ll assume that we’re writing a single page application to keep the code simple, but it’s straightforward to extend these techniques to Android applications or to multi page websites by running in a background thread or by periodically saving the state of computation in a client cache (but that is the subject of another article altogether).
To do this, we need the following ingredients:
- Some fast moving metric of interest (we’ll use DNS time for each network request today)
- A small bit of javascript to handle the aggregation
- A logging endpoint (such as the one from Part 1)
- An estimate of importance for the metric (how ok are we with losses?)
Why DNS? Because Haiku.

Fortunately all of these techniques apply to any metric that you choose (how fast the browser responds to requests, how quickly the screen repainted on scroll, how far the user read in your article, etc). Just as with all things on the open web, this won’t work on every browser in existence (especially those with javascript disabled!), but nearly any browser that supports AJAX (nearly all of them) should be fine. We’ll prototype with a recent version of Chrome, since it’s popular, free, and makes development easier.
The Pieces:
I. Capturing DNS Time
DNS can be a bit tricky to work with in development, due to the possible caching tiers (possibly in the browser, on your machine, at your ISP, upstream of your ISP, etc). While developing, I prefer to use the total request duration instead to keep a clean signal, but I’ll leave that to you.
We’ll be harvesting NavigationTiming / PerformanceTiming data for this example as it’s a good “fast metric”, but regardless the data source (scroll speed? Elements of app load time? Keypresses per game?), all of these techniques apply equally. To try to keep the code simple, I’m just using straight vanilla javascript, targeting recent evergreen browsers, but the path to very wide browser support can be unlocked with widely available modules.
Here’s the W3C definition of the elements of a browser request:
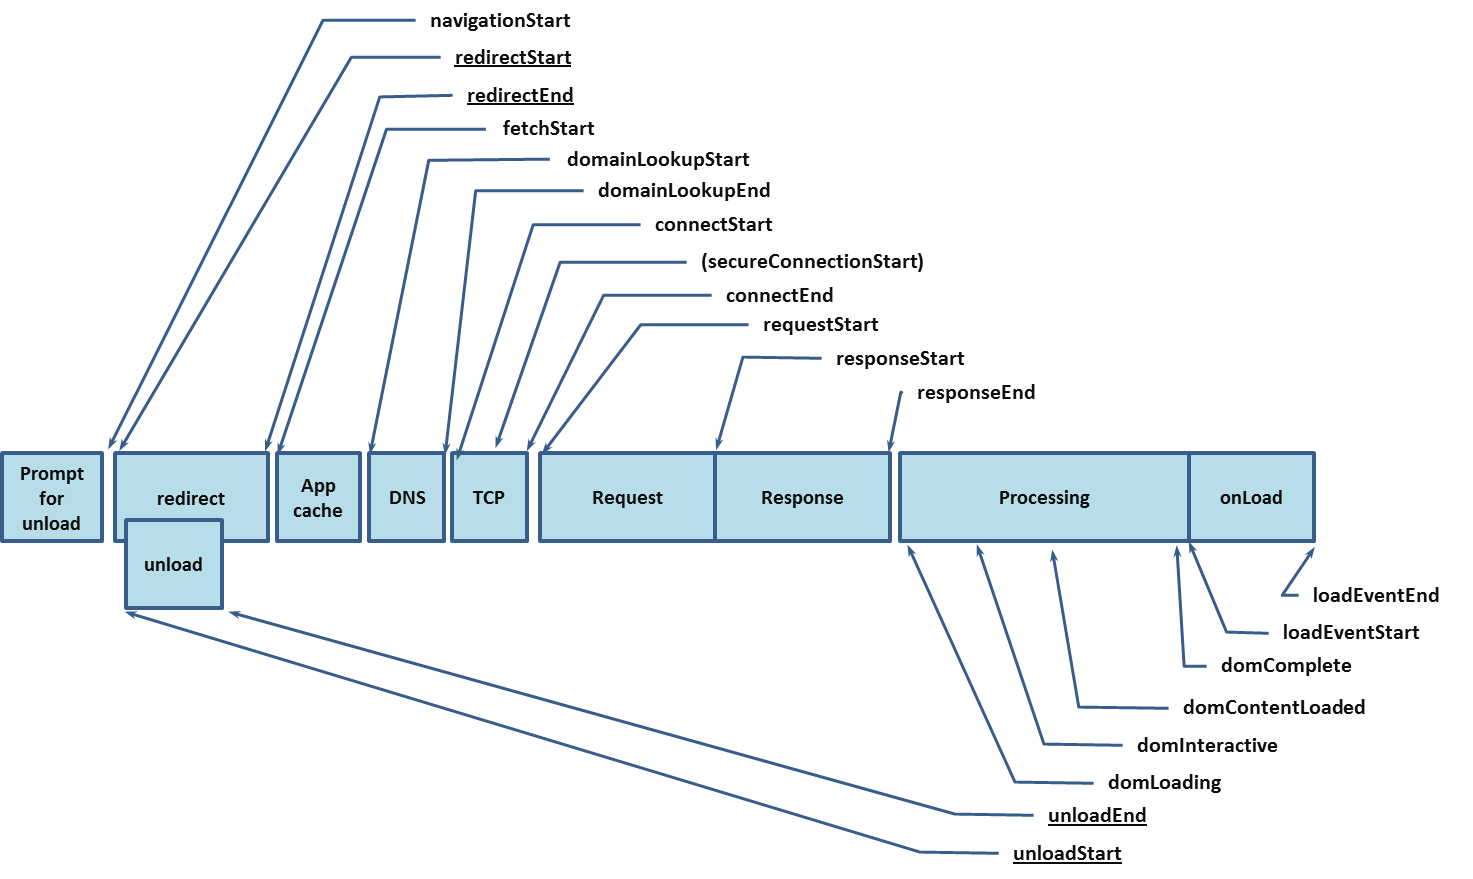
To simplify to just a few measures, I’ll use the following definitions (units are generally ms):
- dnsTime = domainLookupEnd - domainLookup
- duration = loadEventEnd - navigationStart (total time for the request)
- connectTime = connectEnd - connectStart
- transactionTime = loadEventStart - connectStart (request time without DNS)
- rttfb (response time to first byte) = responseStart - connectStart
- size, which is rather imprecise (it’s an approximation of the document length, not the bytes on the wire, which would arguably be more useful in this case, but isn’t currently easy to get from a user’s browser).
Due to the history of the standards, the times for the base page load show up in window.performance.timing as a PerformanceNavigation object, but the buffer of additional resources (including XHR / AJAX requests) will show up as PerformanceTiming objects in window.performance.getEntries(), which isn’t as widely supported. To clarify the differences, I broke collecting these into two functions, as there are a few minor name changes between the two objects:
collectBaseTimings- handles the base page load stats (PerformanceNavigation).collectAdvancedTimings- handles the additional resources (PerformanceTiming).
collectAdvancedTimings looks like this (collectBaseTimings is nearly identical, without the loop since there’s only one object):
function collectAdvancedTimings() {
    var pe = window.performance.getEntries();
    var allLoadStats = [];

    for (var i = 0 ; i < pe.length ; ++i) {
        var p = pe[i];
        var loadStats = {
            dnsTime: Math.round(p.domainLookupEnd -
                             p.domainLookupStart),
            duration: Math.round(p.duration),
            connectTime: Math.round(p.connectEnd -
                    p.connectStart),
            transactionTime: Math.round(p.responseEnd -
                    p.connectStart),
            rttfb: Math.round(p.responseStart -
                    p.connectStart),
            size: p.transferSize
        };
        if ("loadEventStart" in p) {
            loadStats["transactionTime"] =
                Math.round(p.loadEventStart - p.connectStart);
        }
        if ("transferSize" in p && p["transferSize"] === 0) {
            // p.transferSize === 0 probably means cache
            loadStats["cached"] = true;
        }
        allLoadStats.push(loadStats);
    }

    return allLoadStats;
}
I left the other common measures in the returned object, but feel to instrument to taste.
Not much magic here - I grab the performance timing object, then pull out the measures of interest and compute the deltas I want to log. I like to be clear on which “first byte” I’m talking about when labeling the variable - response-time-to-first-byte (rttfb) - I haven’t found the first byte the browser writes on a connection as useful (aside from studying cached connection usage).
There are many nuances to collecting these types of RUM metrics, but I recommend looking at Steve Souders’ Resource Timing practical tips.
II. Creating a List to log
If the metric isn’t moving terribly fast, one option is to just capture every data point and send those up in a batch. Given the above data points, this would be one way to collect dnsTime metrics:
var timings = collectAdvancedTimings();
var dnsTimeList = timings.map(function(x){return x.dnsTime;});
xhrPost({url: "http://LOGSERVERIPORNAME:5000/", body: JSON.stringify(dnsTimeList)});
We pick the timings up from the above code, and then we map over the resulting array and pull out the dnsTime for each entry. I’ll talk about xhrPost below, in “Building a Log Sender”.
There’s two disadvantages to this approach:
- It costs data for every data point, with potentially unbounded memory use,
- It takes further server processing to aggregate the data in order to see the distribution.
III. Flat Histograms
What’s a histogram? It’s just a series of buckets into which we can put our data samples; instead of storing all of the raw data, instead we just count how many samples fit into each bucket. As a simple example, suppose we roll a normal die and store the results with one bucket for each possible die roll. Let’s roll a die 20 times:
4 4 2 6 3 1 6 2 3 6 1 6 3 3 1 5 1 6 6 1
and histogram the results with one bin per possible roll (one bucket for 1-6):
Rolls of 1: 5
Rolls of 2: 2
Rolls of 3: 4
Rolls of 4: 2
Rolls of 5: 1
Rolls of 6: 6
(from this small sample, we might worry that this die was a bit loaded, but I’ll leave fair dice up to others.)
We can make each bucket cover two digits and get an even smaller summary, by sacrificing some resolution as to what was actually rolled:
Rolls of 1 and 2: 7
Rolls of 3 and 4: 6
Rolls of 5 and 6: 7
Note that by losing some of the resolution, the die rolls suddenly look more fair, so be careful with how you set your buckets (bins) up of the histogram; beware of Simpson’s Paradox!
This solves our earlier two issues by having the client aggregate the data for us, and being flat in memory usage (in addition to being easy for the CPU to compute). Here’s a basic javascript implementation that handles building flat histograms (with bins of the same size) for you. All you need to do is specify the name of the metric you’re collecting, what range you want to cover (the minimum and maximum values), and how many buckets you want to use - the code takes care of the rest, although I’ve only tested it lightly.
This routine creates the buckets with constant spacing:
function initializeBucketRanges(minimum, maximum, bucketCount) {
    var buckets = [];
    buckets.push(minimum);

    // doesn't deal with:
    //   * a bucket that's rounded to one of the endpoints
    //   * buckets that may be identical
    //   * buckets where the calculated step is 0

    var i;
    var step = Math.round((maximum - minimum) / (bucketCount));
    var lastBucket = minimum;
    for (i = 1 ; i < (bucketCount) ; ++i) {
        lastBucket += step;
        buckets[i] = lastBucket;
    }

    buckets.push(maximum);

    return buckets;
}
This resets all counts in the histogram to zero:
function zeroArrayOfSize(size) {
    // TODO: race condition if we zero and add at the same time
    return Array.apply(null, Array(size)).map(Number.prototype.valueOf,0);
}
And here’s the class constructor:
var FlatHistogram = function(name, minimum, maximum, bucketCount) {
    // need at least 2 buckets for min and max
    if (minimum > maximum || bucketCount < 2 || typeof name !== "string") {
        throw "invalid params";
    }

    this.name = name;
    this.layout = "F/" + minimum + "/" + maximum + "/" + bucketCount;
    this.counts = zeroArrayOfSize(bucketCount);
    this.buckets = initializeBucketRanges(minimum, maximum, bucketCount);
};
I’ll add a few methods - addCount, which adds “count” number of samples to the bucket that corresponds to “value”, stringify, to serialize the bucket to something that we can log, and reset to reset the histogram (in particular after we send it up):
FlatHistogram.prototype = {
    addCount: function addCount(value, count) {
        var i;

        // drop those below minimum
        if (value < this.buckets[0]) {
            // dropping value
        } else {
            // finding the first bucket greater than the value
            // there's one less count than buckets (all counts must
            // be between two values, drop things below the first)
            // Using a simple linear traversal, could be faster with a binary search
            for (i = 1 ; i < this.buckets.length ; ++i) {
                if (value < this.buckets[i]) {
                    this.counts[i-1] += count;
                    break;
                }
            }
        }
    },
    stringify: function stringify() {
        var i;
        var result = {};
        var data = {};

        for (i = 1 ; i < this.buckets.length ; ++i) {
            data[this.buckets[i]] = this.counts[i-1];
        }

        return JSON.stringify({
            name: this.name,
            layout: this.layout,
            data: data
        });
    },
    reset: function reset() {
        this.counts = zeroArrayOfSize(this.counts.length);
    }
};
To use it, we just initialize a new histogram, then add some counts to it:
var hist = new FlatHistogram("dierolls", 0, 200, 10);
// assume we get one sample of 28:
hist.addCount(28, 1);
// or three samples of 57:
hist.addCount(57, 3);
// And we want to see the result:
console.log(hist.stringify());
Which outputs (with a few newlines added):
{"name":"dierolls","layout":"F/0/200/10",
"data":{"20":0,"40":1,"60":3,"80":0,"100":0,
"120":0,"140":0,"160":0,"180":0,"200":0}}
where we can see our count of 28 in the 20-40 bucket, and the counts of 57 in the 40-60 bucket. I’ve included the layout of the histogram (“F” signifying a FlatHistogram, minimum of 0, maximum of 200, with 10 buckets). When sending this to the server, since we can recompute (or cache) what all the buckets will be for that layout, we can suppress sending values with a zero count without losing any client information, useful when a lot of your bins have nothing in them:
{"name":"dierolls","layout":"F/0/200/10","data":{"40":1,"60":3}}
Now we’re ready to send the logs along.
IV. Building a Log Sender The way that we send logs will depend a lot on how your application works, and is a topic on its own. To stay simple, we’ll assume that we just want to send the logs once at the end of a page load, waiting a little bit for the assets to load. For single page (web)apps and for smartphone / smarttv applications, we can just setup a timer to send every hour or so, as long as there’s some data available, and let the timer handler deal with checking if there’s anything worth logging.
If the application has a notion of a scheduler, it’s best to schedule the logging job to be at the lowest possible priority during idle time, so as to stay out of the way of the user. A simple approximation of this is to just install a timer that fires a short time after the page loads, and checks to see when the last mouse and keyboard events are. If the user is active, the handler can reschedule itself to look again in the future (with some jitter and backoff) until it finds a quiet time to send. Another strategy could involve writing the data in local storage and sending it later when it’s more convenient, balancing the risk of small data loss against keeping user interactivity at its best, which is probably a good trade.
xhrPost is just a simple wrapper around XMLHttpRequest for handling actually sending the data, here’s the reference implementation in vanilla JS:
function xhrPost(options) {
    var xhr = new XMLHttpRequest();
    xhr.timeout = options.timeoutMs || 10 * 1000; // in ms
    xhr.open("POST", options.url);
    // Setting this means having CORS allow Content-Type headers; staying simple
    //xhr.setRequestHeader("Content-Type", "application/json");
    xhr.send(options.body);
}
In practice, you’ll likely want to reuse whatever ajax library you already have (jquery or request handle this across browsers much better, and have more robust error handling).
Next Time
Now we have all of the elements for collecting data at a client (using a web example), and we have a way to start filling the logging pipeline that we set up in the last part. If we get more clever with our binning, we can get more information from the same or less bytes by using histograms with exponential spacing, or using more advanced histogram libraries. After that, we’ll be ready to begin analyzing our data!