FastMetrics, Part 1 - Building a Log Server
How to monitor fast moving metrics out in the wild, without averaging or sampling.
Background
There are those that believe that we cannot log all of the data that we need in order to make a decision from something as large and as mind bogglingly fast moving as the open Internet. And then there are those that do it, and collect all the data needed to make excellent product decisions, based on eye-ball metrics (those that are true all the way to the eyes of your users) from real people using an actual product.
Ask yourself - which camp do you want to be in? To those that are somewhere in the middle, let me show you how to do it, and join the ranks of believers that Data > Opinions.

For those of you that attended my recent talk at Monitorama 2017, I present to you the missing notes on the practical aspects of wiring this all up. For everyone else that just want to see a full end to end example, buckle up, because here we go!
I broke this dialogue up into five easy to consume parts, or if you already have your logging and data collection rigged up, just skip to the fifth part on how to generate the plots and analytics:
- Having Somewhere to Log (this article),
- Client side aggregation,
- Improving resolution in the area of interest,
- Mapping from IP to ASN, and
- Aggregation and Analysis
Of course, you may already have one or all of these pieces available to you in your current stack - the pieces are straightforward, but included for completeness. For these articles, I’ll take high volume network metrics from web clients, but this technique really applies to any sort of data - key or scroll responsiveness, reading duration, or even protocol development.
I owe a debt of gratitude to both Jim Roskind and Steve Souders for inspiring this work with their talks at Netflix that I was fortunate enough to attend, and the many engineers and data scientists that paved the way on this work. See the appendix for more details and links to further resources.
Today’s Agenda:
For this example, I’ll be using a tiny AWS EC2 instance without clustering, to develop the idea. I chose these pieces for their ability to scale horizontally as wide as your data volume grows, but there’s no need to start with a Netflix sized cluster of servers, just as long as there’s a clear path on how to scale up.
Here’s our ingredients:
- An Amazon AWS account
- An Ubuntu instance to work on
- ssh access to that instance!
- A fronting web server (I’ll use Python3 + Flask)
- Apache Kafka
I’m going to err on the side of simplicity for explanatory purposes where there’s a wealth of information on the horizontal scaling (such as for a worldscale kafka cluster or writing the web server in assembly), but if you’d like to see more detail on that, please let me know. The techniques equally apply to a go server just the same as a node one, but perl probably has the best chance of doing it in one line.
The pieces:
I. Configuring Ubuntu
I’m using the latest LTS release (Xenial, 16.04) on a t2.small, which may be a little underpowered for a busy logging endpoint, but is free tier eligible for experimentation. Note that you’ll need two security ports open when selecting your security group - ssh (default: TCP/22 from your external IP address) and Flask development server (default: 5000/TCP from all hosts that need to log to the development server). Kafka’s default configuration needs at least 1GB of RAM free above the OS, so the 1GB t2.micro is just a tiny bit too small for use, although even a Raspberry Pi Zero W can be configured to work with some additional effort.
We’ll need 4 shells for the commands, or just one screen/tmux session - the choice is yours:
# on terminal one
sudo apt-get update
sudo apt-get install -y screen openjdk-8-jre-headless
# openjdk8 was version 1.8.0_131 at this time

# if you would like to use screen, add this:
cat > .screenrc <<EOF
caption always "%{-b ..}%-w%{+b ..}[[%n%f*%t]]%{-}%+w"
startup_message off
defscrollback 10000
EOF
screen
# and feel free to start the four terminals
Feel free to apply any security items you like (such as taking sshd off port 22, adding a firewall, adding your host key, or your own PAM setup). For the tutorial, I’ll keep the servers attached to terminals to make it easy to see the logging, but you’ll want to use the daemon setup in production. You should either start your screen / tmux session or have your shells open at this time.
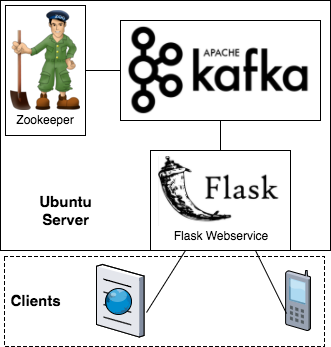
II. Single Server Kafka
There’s a great guide to setting up kafka on the apache site, but for our purposes, I’ll setup a trivial node with zookeeper (distributed coordination, but still a dependency) and kafka’s server.
On terminal 1, download kafka + zookeeper and run zookeeper from the user home directory:
# still on terminal one
wget http://apache.claz.org/kafka/0.10.2.1/kafka_2.12-0.10.2.1.tgz
tar -xvzf kafka_2.12-0.10.2.1.tgz
# should see a lot of files get unpacked
cd kafka_2.12-0.10.2.1
bin/zookeeper-server-start.sh config/zookeeper.properties
Then on terminal 2, run kafka:
# switch to terminal two
cd kafka_2.12-0.10.2.1
bin/kafka-server-start.sh config/server.properties
If everything worked correctly, zookeeper should end with:
[2017-07-10 06:15:13,986] INFO binding to port 0.0.0.0/0.0.0.0:2181 (org.apache.zookeeper.server.NIOServerCnxnFactory)
and kafka should end with:
[2017-07-10 23:09:33,985] INFO [Kafka Server 0], started (kafka.server.KafkaServer)
Then we’ll need to create a topic for our log messages to be sent to or read from. I’ll name the topic “test”, to remind us to do more detailed configuration for production:
# switch to terminal three
cd kafka_2.12-0.10.2.1
bin/kafka-topics.sh --create --zookeeper localhost:2181 \
  --replication-factor 1 --partitions 1 --topic test
Kafka should let us know that the topic was created, and we’re ready to fill it.
Kafka can handle the message feed at LinkedIn, and is ready to scale out to handle astronomical amounts of message flows. I recommend taking a look at their tutorials and documentation to see how to add multiple servers to the cluster to handle wider message volumes as well as introducing fault tolerance and transaction recovery.
III. Python and the Fronting Web Server
Excellent, our data pipeline is setup, now we need a web server to accept log traffic and produce kafka messages with the data in it. For simplicity, I’ll be using Flask and the python KafkaClient in standalone mode without TLS, but in production you would want to run this inside a proper WSGI server with as many servers load balancing inbound requests (all writing to the kafka pipeline) with more advanced failure and retry logic, as well as implementing some basic authentication to cut down on traffic from bad actors. As this is only a webservice and not designed for interactive use, you may want to keep the WSGI server off port 443 / 80 to avoid the trivial script probes. While it’s useful for debugging and development to be able to stop and start the server, you would want this service to come up automatically as a daemon at boot time.
We’ll need a virtualenv in which to run the code, along with a basic Flask endpoint script:
# still on terminal three
cd
sudo apt-get install -y virtualenv

virtualenv -p python3 v0
. ./v0/bin/activate
pip install kafka-python flask
Producing a kafka message only takes 3 lines of python after the imports; don’t run this or you’ll need to drain your message queue with the trivial message, but it works!
# not for any terminal!
from kafka import SimpleProducer, KafkaClient
kafka = KafkaClient("localhost:9092")
producer = SimpleProducer(kafka)
producer.send_messages("test", "{}".encode("utf-8"))
All this does is open a connection to the local (or remote) kafka server, get a message producer, and send a trivial object “{}” encoded as utf-8 on topic “test”. We’ll need to decorate this with some web handling logic to be able to accept log messages from remote clients.
IV. Web Front Server - Kafka Producer
Flask is a bare bones web server framework for python that lets us avoid a lot of the boilerplate code needed to handle web requests. This is a “logserver.py” that accepts requests sent to “/” and sends the posted data to kafka:
# still on terminal three in virtualenv "v0":
cat > logserver.py <<EOF
from time import time
from flask import Flask, Response, request, make_response
from kafka import SimpleProducer, KafkaClient
from kafka.errors import FailedPayloadsError, KafkaUnavailableError
import json

app = Flask(__name__)

kafka = None
producer = None
topic = "test"
MAX_PUBLISH_ATTEMPTS = 3

def safe_reconnect():
    global producer, kafka
    succeeded = False
    try:
        kafka = KafkaClient("localhost:9092")
        producer = SimpleProducer(kafka)
        succeeded = True
    except KafkaUnavailableError as inst:
        print("safe_reconnect: failed, KafkaUnavailableError")
    return succeeded

def send_message_with_retries(epochtime, src_ip_address, data):
    global producer, kafka, topic
    for attempt in range(MAX_PUBLISH_ATTEMPTS):
        try:
            source_data = json.loads(data.decode("utf-8"))
            wrapped_data = {"d": source_data, "et": epochtime, "sip": src_ip_address}
            producer.send_messages(topic, json.dumps(wrapped_data).encode("utf-8"))
            return True
        except FailedPayloadsError as inst:
            print("trying to reconnect Kafka (FailedPayloadsError)...")
            safe_reconnect()
        except ValueError as inst:
            print("dropping invalid json")
            break
    return False

@app.route("/", methods = ["POST", "OPTIONS"])
def index():
    success = None
    if request.method == "POST":
        data = request.get_data()
        success = send_message_with_retries(int(time()), request.remote_addr, data)
    resp = make_response("Published: %s\n" % success, 200)
    resp.headers["Access-Control-Allow-Origin"] = "*"   # naughty, set to your hostname
    resp.headers["Access-Control-Allow-Headers"] = "Content-Type"
    return resp

if __name__ == "__main__":
    safe_reconnect()
    app.run(host="0.0.0.0", debug=False)
EOF
I added the kafka retries as I noticed that the flask server lost its connection handle a lot in the default configuration. I know, the globals are naughty, there’s a few return paths, and we shouldn’t be running the development server on 0.0.0.0, but there it is.
At its core, this server isn’t doing very much:
- It accepts “POST” (with oversimplified CORS handling) messages to the root path “/”,
- It tries a few times (3) to send the request data, along with the time and source IP address, as a JSON encoded message to Kafka,
- It reports back on how that went.
There’s a little more code to reconnect in case we lost the kafka connection, detect invalid JSON in the body, and catch a few errors. I left the data in JSON (and avoided better serialization like arvo) to keep things simple, but in practice, you can save yourself a lot of parsing cost by using binary serialization with a library and still keep the easy debuggability.
We’ll need to start the server. In practice, you wouldn’t want the development server to be on a publicly addressable IP / port, but I’ll leave that to others to explain.
# still on terminal three in virtualenv "v0":
python logserver.py
After which Flask should let you know that it’s ready and listening, and you can see requests get logged when they come in.
It’s worth using a proper WSGI (or other) endpoint, changing the response codes to reflect failures, returning consumable JSON, serializing with SerDe, and pacing clients to avoid a thundering herd / attack mitigation, but I’d prefer to stick to the basic parts for this article. For now, we’ll just always return a 200 and a simple text message.
V. Verifying Data - Kafka Consumer (lite)
So, how do we know that all of this works? We can use curl to send some test data to the webservice and check that it made it into the queue:
# switch to terminal four
# save a sample data blob in a JSON file:
cat > t1.json <<EOF
{"name":"duration","layout":"E/1/30000/48",
 "data":{"721":82,"887":123,"1091":211,
   "1342":20,"1651":8,"2031":16,
   "2498":13,"3073":5,"3780":3,"4650":6,
   "5720":1,"7037":2,"8657":3,"10649":2,
   "13100":3,"16115":1,"2147483647":915}}
EOF
# and send the data to the log server:
curl -v -X POST --data-binary @t1.json http://127.0.0.1:5000/
If all went well, we should see the headers along with Published: True, and there we are, the log server is ready for action!
Incidentally, consuming the kafka topic with the same python KafkaClient (via SimpleConsumer) is also only a few lines of code, but buyer beware. Kafka wasn’t designed around small volumes of producers and consumers, so if you set up a consumer with a given group id, it’s entirely possible that only that group id will be able to read data from that topic if the topic is automatically sharded, so I’ll leave showing that until we’re ready to analyze the data.
You can, however, view messages in the topic without consuming them, by using the console consumer included with kafka:
# also in terminal 4:
cd kafka_2.12-0.10.2.1
./bin/kafka-console-consumer.sh --bootstrap-server localhost:9092 \
    --topic test --from-beginning
and we should see the data from t1.json in the shell.
Next Time
Now that we know how to collect log data with a Flask webservice, publish it to a kafka topic, and verify that it really made it there, we’re ready to begin collecting data at the clients. In the next article, we’ll summarize data on the client into histograms that maximize the resolution for each metric at the area we’re most interested in.